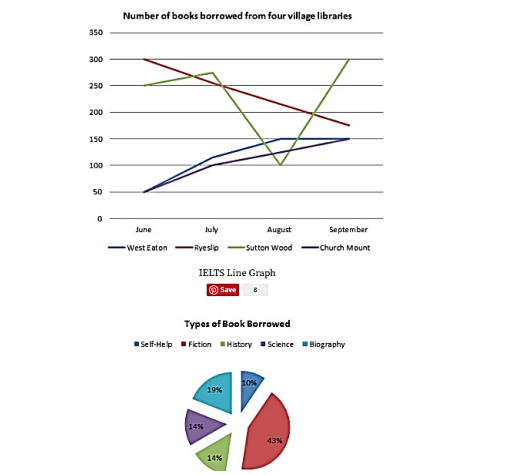
The line graph shows the number of books that were borrowed from four villages in four different months in 2014, and the pie chart shows the percentage of books, by type, borrowed over this time

The graph compares the number of books borrowed from four villages between June and September 2014, and the pie chart reports the proportions of five genres loaned over this time. Among the villages, the sharp reduction in Ryeslip is the most notable. The figure for this was an all-time high of 300 in June, which nearly halved in September (second in rank). By contrast, Church Mount and West Eaton increased almost similarly. Both began at a record low of 50 and, over time, they roughly tippled. The only irregular change was Sutton Wood. It started at 250, but after a mild rise, it rapidly fell to a low of 100 between July and August before sharply rising to 300 – the leading record. The pie chart reveals that the rate of borrowing fiction was the most significant, at 43%, and roughly half as much was reported for biography. The science, history, and self-help books showed the lowest records: between 10% and 14%. Overall, Church Mount and West Eaton consistently rose, whereas Ryeslip experienced a sharp decline, with Sutton Wood exhibiting irregular behavior. Additionally, the figure for borrowing fiction was nearly as large as the other genres combined
IELTS Writing Task 1 by Yaser Noorbakhsh
جهت دانلود سمپل های بیشتر به قسمت دانلود وبسایت مراجعه نمایید.